React and D3 Integration

There is a YouTube video for this demo here: https://youtu.be/XdPBM5N07cE
This shows how to use the visualization library D3 with the React framework. This not trivial because D3 works by directly manipulating an SVG object with the HTML DOM, whereas React works with a virtual DOM that is converted and injected into the HTML page at render time. The video has a complete walkthrough and this post explains some of the details in the video.
If you are new to React these are the steps I took to create the project. You will need to have the React and NPM installed already. You might need to use ‘sudo’ for the npx and chown commands depending on your security configuration. These commands are what I used on my Mac but React will install on Windows and Linux as well. The installation and setup are not the purpose of this BLOG post, I’m including them so you can set up the demo to work on your system. You can skip all of these steps if you just want to read about how to do the integration.
Setup
Create the React project:
npx create-react-app d3-demoChange the ownership if you need to:
sudo chown -R {your user name} d3-demoRun the default project to make sure basic setup is ok:
cd d3-demo
npm start
Your browser should open at http://localhost:3000 and show you the default React page. You can download all the demo files here. It’s just the Javascript and React source files to drop into you react directory structure.
https://www.dropbox.com/s/lgzms6283r31d6l/React-D3.zip?dl=1
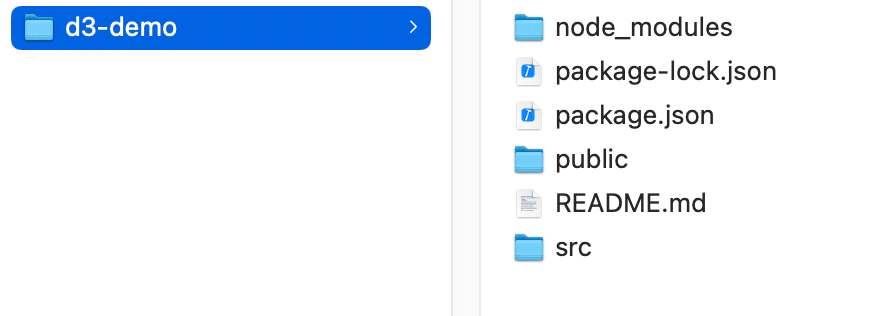
The directory structure should look like this
D3/React Integration
First public/index.html. It’s quite simple.
<!DOCTYPE html>
<html lang="en">
  <head>

    <link rel="stylesheet" href="/Demo/Demo.css">

    <!-- Make sure global.js is first. -->
    <!-- The chart code and React code will add functions to its objects -->
    <script src="/Demo/global.js"></script>

    <!-- The D3 V3 library -->
    <script src="/Demo/d3.v3.min.js"></script>

    <!-- A D3 chord chart -->
    <script src="/Demo/chart.js"></script>

    <title>React/D3 Demo</title>
</head>
<body>

	<!-- the React root. React "owns" this -->
        <div id="React-Root"></div>

	<div id="chart-label" class="ChartLabel">D3 Region</div>

	<!-- the chart div where the D3 chart is created -->
	<div id="D3-Chart" class="ChartDiv"></div>

  </body>
</html>
The imports are global.js (see later), D3 V3, and chart.js (our chord chart, see later). You can see the “React-Root” div where the React components are injected into the HTML DOM.
You can also see the “D3-Chart” div where D3 adds its SVG object.
The Javascript file public/global.js is where the integration points are defined.
    // These are React functions that can be called from Javascript
    window.ReactFunctions = {};

    // These are Javascript functions that can be called from React
    window.JavascriptFunctions = {};
It defines two Javascript objects that the Javascript code and the React code use to provide functions that the other technology can call.
On line 11 in public/chart.js the function to replace the chord chart with a new one based on fresh data – updateChart is added to window.JavascriptFunctions. This can now be called from a React Component.
    window.JavascriptFunctions.updateChart = function(d) {
      ...
    }
Looking at the React code we can see in src/ValueHint.js (which provides the mouse-over hint) that on line 13 ValueHint makes the React function chartMouseOver available to Javascript code.
    // make the mouseover function available to D3/Javascript
    window.ReactFunctions.chartMouseOver = chartMouseOver;
Going back to public/chart.js we can see where this React function is called when the user moves the mouse over part of the D3 chord chart (line 150-164).
    function pathMouseOver(d) {

      if (d.source && d.target ) {
	// Identify the information for the mouse over
	var source = chartData.items[d.source.index];
	var target = chartData.items[d.target.index];
	var measure = chartData.value;
	var value = chartData.matrix[d.source.index][d.target.index];

	// Call the Reaction function to display the mouse over hint
	console.log("Calling window.ReactFunctions.chartMouseOver "+target+" "+source);
	window.ReactFunctions.chartMouseOver(source, target, measure, value);
      }

    } // pathMouseOver
The YouTube video linked above and the demo project files should help you understand what is happening on both the React and D3 side of the integration.

Leave a comment